- Eradiate/
- Latest News/
- Estimating the accuracy of 1D radiative transfer models over the Libya-4 site/
Estimating the accuracy of 1D radiative transfer models over the Libya-4 site
Climate and environment monitoring from space observations require the acquisition of radiances with very high radiometric accuracy and precision. Radiometers on-board Copernicus Sentinel satellites have been designed to meet such requirements, providing user communities with space-based radiance data with relative accuracy and precision around 2- 3%. Accuracy and precision of these observations must be routinely monitored over a long period of time to support these demanding requirements. Vicarious calibration plays a critical role in both verifying the accuracy of the calibration of radiometers and monitoring calibration degradation over time. Radiative transfer modelling is a key element for Earth Observation data exploitation and is critical to support vicarious calibration activities. This type of activity has been important for the verification of the calibration of MSI on-board Sentinel-2 (Lamquin et al. 2019) or SLSTR on-board Sentinel-3.
Pseudo-invariant calibration sites such as bright deserts are often used as reference sites for absolute vicarious calibration. In that case, the calibration reference consists of simulated radiance or reflectance at the satellite-level. Simulating satellite observations requires characterisation of the optical properties of the surface and atmosphere, as well as the associated uncertainties (e.g. Govaerts and Clerici 2004). The Guide to the Expression of the Uncertainty in Measurement (BIPM 2008) provides a methodology to combine these uncertainties into a single value; however, this approach does not account for uncertainties resulting from the numerical simulation process. To estimate these specific uncertainties, four different 1D radiative transfer models, operated in similar conditions, have been compared over one pseudo-invariant calibration sites, namely Libya-4. Radiative transfer models are usually compared through benchmarking in ideal conditions such as monochromatic band, neglecting molecular absorption, or Lambertian surfaces (e.g. I3RC, IPRT, RAMI). Simulating satellite data over Libya-4 however requires accounting for actual observation conditions where all significant radiative transfer processes should be taken into account. The current comparison focuses on the spectral regions of SLSTR bands S1 (550 nm), S2 (660 nm), S3 (840 nm), S5 (1620 nm) and S6 (2200 nm).
Table 1: List of radiative transfer models used for this comparison. The “Molecules” column lists the molecules accounted for the computation of gaseous transmittance and the “Transmittance” column lists the numerical method used to estimate this value.
| Code | Reference | RTE solver | Molecules | Transmittance |
|---|---|---|---|---|
| 6SV | Kotchenova et al. 2006 | Successive Order of Scattering | H2O, O3, O2, CO2, CH4, N2O | Random exponential band model |
| LibradtranV2 | Emde et al. 2016 | Monte Carlo Ray Tracing | O3, O2, H2O, CO2, NO2, BRO, OCLO, HCHO, O2, SO2, CH4, N2O, CO and N2 | Representative |
| RTMOM | Govaerts 2006 | Matrix Operator Method | H2O, O3, O2, CO2, CH4, N2O and CO | Correlated k-distribution |
| ARTDECO | Adding-doubling | H2O, O3, O2, CO2, CH4, N2O, NO2 CO, SO2 and N2 | Correlated k-distribution |
The radiative transfer models used in the comparison are listed in Table 1. They were operated using exactly the same surface reflectance model (Rahman et al. 1993), the same aerosol model (Govaerts et al. 2013) and the same water vapour and ozone concentrations taken from ECMWF reanalysis data. For other features such as molecular transmittance, simulations rely on models’ built-in capabilities to keep simulation conditions close to operation by an average user unaware of software internals or possibly undocumented advanced features. These models rely on different numerical methods to solve the radiative transfer equation, estimate the molecular absorption and couple this process with volume scattering.
Table 2: List of radiometers used for the model comparison. Nbr. Obs. is the number of clear-sky observations acquired over Libya-4.
| Platform | Radiometer | Data version | Nbr. Obs. |
|---|---|---|---|
| AQUA | MODIS | Collection 5 | 120 |
| Envisat | MERIS | Third reprocessing | 230 |
| Landsat-8 | OLI | Collection 1 | 25 |
| Sentinel-2A | MSI | Baseline 02.07 | 35 |
A series of observations acquired over Libya-4 by well-calibrated radiometers were used as a basis for the actual condition simulations. The list of radiometers is displayed in Table 2. Only data acquired with illumination or observation zenith angles smaller than 30° are considered. These instruments have a typical calibration accuracy of about 2 to 3%. Each observation was simulated as described by Govaerts et al. (2013) with the four radiative transfer models in the aforementioned spectral bands. An example of the estimated mean relative bias and its associated standard deviation is shown in Figure 1 for the AQUA/MODIS observations. In that specific example, the mean relative bias between observations and simulations do not exceed ±2% whatever the model and spectral band. The magnitude and sign of bias however vary noticeably depending on the radiative transfer model. The standard deviation of these distributions is reported in Table 3.
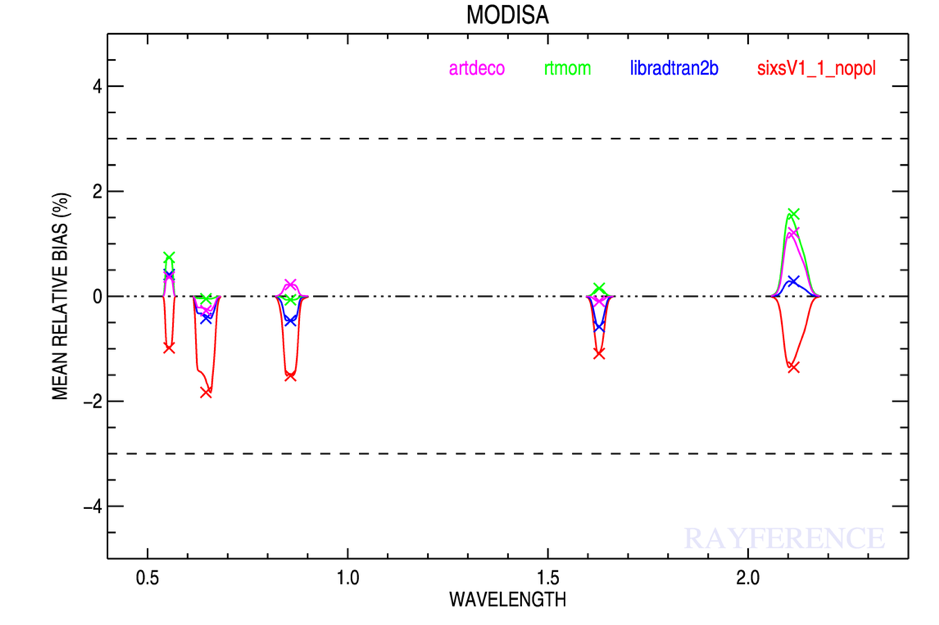
Figure 1: TOA BRF mean relative bias between observation and simulation over Libya-4. The spectral range of each simulated band is represented by the shape of its spectral response and the magnitude of the bias by the × symbol. The maximum of the spectral response shape is scaled to this value. The following color code is used for the radiative transfer models: ARTDECO (magenta), RTMOM (green), LibRadtran (blue) and 6SV (red). Wavelength is expressed in μm.
Table 3: Mean relative bias and associated standard deviation in percent between satellite TOA BRFs and simulated data generated with 4 radiative transfer models over Libya-4.
| Spect. region | 550 nm | 660 nm | 840 nm | 1620 nm | 2200 nm |
|---|---|---|---|---|---|
| AQUA/MODIS | |||||
| Band | B4 | B1 | B2 | B6 | B7 |
| 6SV | -0.98±1.03% | -1.83±0.75% | -1.51±0.77% | -1.09±0.47% | -1.35±1.22% |
| LibRadtran | +0.41±1.06% | -0.42±0.78% | -0.46±0.81% | -0.58±0.57% | +0.28±1.34% |
| RTMOM | +0.74±1.09% | -0.05±0.80% | -0.07±0.78% | +0.15±0.50% | +1.57±1.27% |
| ARTDECO | +0.36±0.99% | -0.28±0.74% | +0.22±0.66% | -0.09±0.37% | +1.21±1.01% |
| Envisat/MERIS | |||||
| Band | B5 | B7 | B13 | — | — |
| 6SV | -0.43±0.58% | -0.79±0.42% | -0.57±0.42% | — | — |
| LibRadtran | +0.74±0.87% | -0.03±0.76% | -0.11±0.54% | — | — |
| RTMOM | +1.12±0.64% | +0.25±0.49% | +0.16±0.50% | — | — |
| ARTDECO | +0.82±0.95% | +0.06±0.69% | +0.35±0.64% | — | — |
| Landsat-8/MSI | |||||
| Band | B3 | B4 | B5 | B6 | B7 |
| 6SV | -1.05±0.65% | -0.21±0.72% | +0.65±0.70% | -1.88±0.57% | -2.57±1.41% |
| LibRadtran | +1.06±0.56% | +0.73±0.59% | +1.27±0.62% | -1.69±0.68% | -1.39±1.05% |
| RTMOM | +0.48±0.64% | +1.33±0.69% | +1.36±0.75% | +0.78±0.59% | -0.86±1.35% |
| ARTDECO | +0.45±0.64% | +1.06±0.69% | +1.51±0.74% | -0.10±0.58% | -0.98±1.37% |
| Sentinel-2/MSI | |||||
| Band | B3 | B4 | B8 | B11 | B12 |
| 6SV | -0.89±0.67% | +0.64±0.50% | -0.92±0.83% | -1.42±0.30% | -2.77±0.79% |
| LibRadtran | +0.83±0.67% | +1.81±0.43% | +1.57±0.67% | -1.02±0.26% | -1.40±0.62% |
| RTMOM | +0.56±0.59% | +2.10±0.35% | +2.86±0.58% | +1.46±0.21% | -0.68±0.56% |
| ARTDECO | +0.54±0.73% | +1.75±0.52% | +2.21±0.86% | +0.54±0.29% | -0.99±0.83% |
Table 3 summarises the results for all the selected radiometers. The magnitude of maximum mean relative bias between observations and simulations does not exceed ±3% and remains lower than ±2% in most of the cases. These results show that over a land surface composed of sand dunes as Libya-4, it is possible to simulate satellite observations in the 5 key spectral regions with a mean accuracy of about ±3%. In other words, none of these radiative transfer models, when operated in a standard way, provide simulation results significantly different from the observations.
Results however noticeably vary from one model to another. For instance, careful inspection of the mean relative bias obtained with AQUA/MODIS reveals values ranging from -0.98% up to +0.74% depending on the radiative transfer model, which results in a magnitude difference of 1.72%. Table 4 lists the range of mean bias between the four models for all considered radiometers. These values directly indicate the discrepancies between these models when operated in a standard mode and in actual observation conditions. Differences in the processing of the molecular absorption play an important role when it comes to explaining these discrepancies. Additionally, the variety of numerical methods used to solve the radiative transfer equation and the radiative coupling between molecular absorption and scattering or between the surface and the atmosphere also contributes to these discrepancies. While it might have been possible to operate these models with exactly the same molecular transmittance computation method, this would have required substantial code modifications, which requires expertise and time average radiative transfer model users usually do not have.
Table 4: Range of mean relative bias estimated with the four radiative transfer model in each spectral region of the four considered radiometers.
| 550 nm | 660 nm | 840 nm | 1620 nm | 2200 nm | |
|---|---|---|---|---|---|
| AQUA/MODIS | 1.72% | 1.78% | 1.44% | 1.24% | 2.92% |
| Envisat/MERIS | 1.55% | 0.85% | 0.92% | — | — |
| Landsat-8/OLI | 2.11% | 1.54% | 0.86% | 1.98% | 1.71% |
| Sentinel-2A/MSI | 1.72% | 1.46% | 3.84% | 2.88% | 2.09% |
Results shown in Table 4 illustrate the typical accuracy which can be achieved when current 1D radiative transfer models are operated in a standard way in spectral regions featuring high molecular transmittance values. The validation of space-based climate missions dedicated to climate monitoring will require accuracy better than the current 2 to 3%. Improving the numerical accuracy of radiative transfer models and granting access to uncertainty values due to numerical simulation to average radiative transfer model users is therefore critical.
The Eradiate radiative transfer model, currently under active development, is a new effort towards achieving these high accuracy and traceability goals. Eradiate will implement state-of-the-art Monte Carlo ray tracing methods. It will ship capability to simulate radiative transfer on 1D and 3D scenes, with highly accurate coupling between all radiative phenomena. Its powerful abstractions, derived from proven software technology used in production physically based computer graphics environments, will be accessible through a flexible, powerful and easy-to-use interface.
Similarly, dedicated satellite missions (e.g. TRUTHS or CLARREO, which will establish a space-based climate and SI-traceable calibration observing system improving confidence in climate change forecasts), will play an crucial role in providing SI-traceable observations. Such data will be of paramount important to verify the capability of highly accurate radiative transfer model to perform actual condition simulations with an accuracy better than 2%.
The benefits of accurate radiative transfer modelling to support calibration verification is illustrated by the correction of the Sentinel-3A/SLSTR instrument calibration. The simulations presented here were used to verify the radiometric accuracy of the reflective bands of this radiometer. The complete analysis is presented in a dedicated report. The proposed calibration correction factors which should multiply the delivered top-of-atmosphere bidirectional reflectance factor (TOABRF) values are given in Table 5.
Table 5: S3A/SLSTR Level 1b TOA BRF corrections recommended by Rayference.
| Bands | S1 | S2 | S3 | S5 | S6 |
|---|---|---|---|---|---|
| S3A/SLSTR NADIR VIEW | |||||
| Correction | 0.95 | — | — | 1.10 | 1.10 |
| S3A/SLSTR OBLIQUE VIEW | |||||
| Correction | 0.92 | 0.93 | 0.93 | — | — |
The uncertainty of these corrections is estimated to be about ±2.6%. It is expected that Eradiate will allow for significant improvement of the accuracy of this type of calibration correction.
References #
BIPM. 2008. “Evaluation of Measurement Data—Guide to the Expression of the Uncertainty in Measurement.” JCGM 100:2008 GUM 1995 with minor corrections. https://www.bipm.org/en/publications/guides/gum.html.
Emde, C., R. Buras-Schnell, A. Kylling, B. Mayer, J. Gasteiger, U. Hamann, J. Kylling, et al. 2016. “The LibRadtran Software Package for Radiative Transfer Calculations (Version 2.0.1).” Geosci. Model Dev. 9 (5): 1647–72. https://doi.org/10.5194/gmd-9-1647-2016.
Govaerts, Y. M., and M. Clerici. 2004. “Evaluation of Radiative Transfer Simulations over Bright Desert Calibration Sites.” IEEE Transactions on Geoscience and Remote Sensing 42 (1): 176--187.
Govaerts, Y. M. 2006. “RTMOM V0B.10 User’s Manual.” EUMETSAT.
Govaerts, Yves, S. Sterckx, and Stefan Adriaensen. 2013. “Use of Simulated Reflectances over Bright Desert Target as an Absolute Calibration Reference.” Remote Sensing Letters, 523-- 531. https://doi.org/10.1080/2150704X.2013.764026.
Kotchenova, S. Y., E. F. Vermote, R. Matarrese, and F. J. Klemm. 2006. “Validation of a Vector Version of the 6S Radiative Transfer Code for Atmospheric Correction of Satellite Data. Part I: Path Radiance.” Applied Optics 45: 6762–74.
Lamquin, Nicolas, Emma Woolliams, Véronique Bruniquel, Ferran Gascon, Javier Gorroño, Yves Govaerts, Vincent Leroy, et al. 2019. “An Inter-Comparison Exercise of Sentinel-2 Radiometric Validations Assessed by Independent Expert Groups.” Remote Sensing of Environment 233 (November): 111369. https://doi.org/10.1016/j.rse.2019.111369.
Rahman, H., B. Pinty, and M. M. Verstraete. 1993. “Coupled Surface-Atmosphere Reflectance (CSAR) Model. 2. Semiempirical Surface Model Usable with NOAA Advanced Very High-Resolution Radiometer Data.” Journal of Geophysical Research 98 (D11): 20,791-20,801.